My Todo App Journey: An Automated Cloud-Native Platform
Taking a simple Todo app from kubectl apply on my laptop to a production-grade GitOps platform on GKE: Kustomize, GitHub Actions, Argo Rollouts canaries with metric-driven rollback, and Prometheus/Grafana.
Introduction: The Project That Taught Me Everything
In the world of DevOps, you can read documentation for months, but nothing solidifies your skills like building something real. For me, that “something” was a seemingly simple Todo application. This project, inspired by the practical challenges presented in devopswithkubernetes.com, became my personal deep dive into Kubernetes, taking me from the humble beginnings of kubectl apply on my local machine to orchestrating a state-of-the-art, multi-environment GitOps workflow on Google Kubernetes Engine (GKE).
This post is the story of that journey. It’s a chronicle of the real-world problems, the late-night debugging sessions, and the architectural “aha!” moments that are often left out of the tutorials. It’s proof that by embracing complexity and solving problems from the ground up, you can build not just an application, but a truly professional and resilient platform. This is how I went from knowing Kubernetes to understanding it.
Chapter 1: The Application Stack - A Tale of Three Microservices
The project started with a simple goal: build a Todo app. To truly learn microservice architecture, I broke it down into three distinct services, each with its own responsibility:
- The
todo-backend: The heart of the operation. A Node.js API that handles all business logic, from creating tasks to marking them as done. It is the stateful component, connected to a PostgreSQL database. - The
todo-frontend: The face of the application. A Node.js server that renders the user interface, making calls to the backend to manage tasks. - The
broadcaster: The town crier. A decoupled notification service that listens for events (like “new todo created”) from the backend via a NATS message queue and forwards them to a Discord channel.
This separation was my first major architectural decision, forcing me to think about how services discover and communicate with each other inside a Kubernetes cluster.
Chapter 2: The First Real-World Failure: The Unready Pod
My first deployment to GKE was met with a classic, humbling problem: the todo-backend pod was stuck in a 0/1 READY state. The logs revealed the truth: FATAL: password authentication failed for user "todo_user".
The “aha!” moment was realizing that the PostgreSQL StatefulSet wasn’t running its initialization script because its PersistentVolumeClaim (PVC) already contained data from a previous failed attempt. The database thought it was already set up. This taught me a critical lesson in managing stateful applications: you have to understand the lifecycle of your data. The only solution was to completely delete the PVC and the StatefulSet to force a truly clean start.
Chapter 3: Building a Declarative Foundation with Kustomize
With the application running, it was time to professionalize the deployment process. I abandoned scattered kubectl apply commands and embraced a declarative approach using Kustomize. This was the cornerstone of the entire GitOps structure.
I created a new, dedicated todo-config repository to act as the single source of truth for my cluster’s state. The structure is clean and powerful:
base/: Contains the generic, shared manifests for all services.overlays/: Contains environment-specific patches. This is where the magic happens.- In
overlays/staging, I patch thebroadcasterto disable Discord notifications and remove the database backupCronJob. - In
overlays/production, I use a different patch to enable these features.
- In
This structure means my base configuration is clean and reusable, and the differences between my environments are explicitly and clearly defined in code.
Chapter 4: The CI/CD Pipeline - Automating Staging and Production
With a declarative configuration in place, I built the automation engine with GitHub Actions. Each of the three microservice repositories received its own independent CI workflow. This pipeline perfectly follows the instructions I set for myself, enabling multiple branch-specific environments:
- Deploy to Staging: A
git pushto themainbranch of any service kicks off the workflow. It builds a new image and updates thekustomization.yamlin the staging overlay of thetodo-configrepo. - Deploy to Production: When I’m ready for a production release, I create a version tag (e.g.,
v1.2.0). The same workflow detects this and, instead of updating the staging overlay, it updates the production overlay.
This is the GitOps dream in action. My cluster state is now a direct reflection of my Git history, and deployments are a matter of a simple git push or git tag.
Chapter 5: State-of-the-Art Monitoring with Prometheus and Grafana
A running application is one thing; a healthy application is another. To achieve true production readiness, I built a robust monitoring stack using the industry-standard tools: Prometheus and Grafana.
I deployed a production-ready NATS message queue using its official Helm chart, and with a simple configuration change, I enabled its Prometheus metrics endpoint.
# values.yaml for the NATS Helm chart
metrics:
  enabled: true
  serviceMonitor:
    enabled: true
    namespace: prometheus # The namespace where Prometheus is running
This serviceMonitor object is the key. It tells Prometheus how to automatically discover and start scraping metrics from my NATS cluster. After port-forwarding to the Prometheus pod, I could instantly verify that data was flowing with a simple query
With metrics flowing, the final step was visualization. I port-forwarded to the Grafana service, imported a pre-built NATS dashboard, and was immediately greeted with a real-time overview of my entire messaging infrastructure: CPU and memory usage, message throughput, and active client connections. This isn’t just a pretty graph; it’s the command center for my application’s health.
Chapter 6: Advanced Deployments - Canary Releases with Automatic Rollback
Deploying directly to production is risky. To mitigate this, I implemented an advanced Canary release strategy using Argo Rollouts. This is where the power of the monitoring stack truly shines.
Instead of a standard Kubernetes Deployment, I now use an Argo Rollout resource. This allows me to define a precise, automated release process:
- Initial Canary: When a new version is deployed to production, Argo Rollouts sends only 20% of live traffic to it.
- Automated Analysis: For the next minute, it pauses. During this time, an
AnalysisTemplateI wrote continuously runs a Prometheus query to check the application’s CPU usage. - The Safety Net: If the CPU usage for the new version remains below my defined threshold (
result[0] <= 0.5), the rollout proceeds, gradually shifting more traffic to the new version. - Automatic Malfunction Detection: If the CPU usage spikes, the
AnalysisTemplatefails. Argo Rollouts immediately and automatically aborts the deployment and rolls back to the previous stable version. No human intervention is required.
# A snippet from my AnalysisTemplate
...
metrics:
- name: cpu-usage-sum
  interval: 1m
  count: 5
  provider:
    prometheus:
      address: http://prometheus-kube-prometheus-prometheus.prometheus.svc.cluster.local:9090
      query: |
        sum(rate(container_cpu_usage_seconds_total{namespace='{{args.namespace}}', container!=''}[5m]))
  successCondition: "result[0] <= 0.5"
  failureCondition: "result[0] > 0.5"
This is the pinnacle of a modern CI/CD pipeline: not just automated deployment, but automated, metric-driven safety.
Chapter 7: Professional Touches - Routing and Secrets
With the core application and deployment strategy in place, I tackled two final topics to elevate the project to a professional standard.
1. Hostname-Based Routing with the Gateway API:
Instead of messy path-based routing (/staging/todo), I implemented the industry-standard hostname-based routing. This keeps my application code clean and environment-agnostic.
- How it Works: I used Kustomize overlays to patch my
HTTPRoutemanifest. Thestagingoverlay sets the hostname tostaging.34.36.101.217.nip.io, while theproductionoverlay sets it totodo.34.36.101.217.nip.io. Thenip.ioservice provides a free and seamless way to get wildcard DNS for any IP, allowing me to use professional routing patterns without configuring a real domain.
2. Secrets Management: The instructions allowed me to assume secrets were handled externally, but a professional engineer plans for reality. In a real system, you never commit plaintext secrets to Git.
- The “Easy” Way (What I did for now): I manually created the secrets in the cluster using
kubectl create secret. This works, but it’s not repeatable. - The “Right” Way (The Next Step): The industry-standard solution is to use a tool like HashiCorp Vault or GCP Secret Manager combined with the External Secrets Operator. The operator would run in my cluster, read secret references from my Git repository, and securely fetch the actual secret values from the vault, creating the Kubernetes secrets just in time for my application to use them. This is the most secure and scalable approach.
Chapter 8: Real-World Refinements - Confronting State
As the platform stabilized, I took a step back to critically review my own work. A good engineer knows that the job isn’t just about making things work, but making them work correctly and efficiently. This review uncovered several important discrepancies: the kind of subtle but significant issues that separate a prototype from a production-grade system.
1. The Stateful Frontend: A Lesson in ReadWriteOnce
My biggest “aha!” moment during the review was realizing I had made my frontend stateful, and understanding the implications.
- The Goal: I wanted the random image on the frontend to be persistent. If a pod died, I didn’t want to wait for a new image to be downloaded. I correctly identified that this required a
PersistentVolume. - The Implementation: I attached a
PersistentVolumeClaimto mytodo-frontendDeployment. This worked perfectly for a single replica, and it was a fantastic hands-on lesson in how pods can claim and use persistent storage. - The Hidden Flaw: However, this approach uses a
ReadWriteOnce(RWO) volume. I learned this means the underlying storage can only be mounted by one pod at a time. It was a scaling time bomb. If I had scaled the frontend to two replicas, the second pod would have failed to start because the volume was already “locked” by the first. - The “Right” Way for Shared State: To achieve my goal of sharing one volume across multiple replicas, I would need a
ReadWriteMany(RWX) volume, likely backed by a network file system like Google Cloud Filestore. This is a more advanced solution, but it’s the correct pattern for shared, writable state. For now, I’m keeping the RWO volume as a concrete reminder of this crucial lesson, but I know the path forward for a truly scalable solution.
2. The Image Tag Mismatch Dance: When GitOps Gets Stuck
Even with the correct Project ID, my pods were still failing to pull images, reporting NotFound for tags like staging-initial. This was a crucial lesson in the timing of GitOps.
- The Problem: My
baseKustomize configuration specifiednewTag: staging-initialfor the images. Kubernetes tried to pull these images immediately. However, my CI/CD pipeline builds images with SHA-based tags (e.g.,staging-b287111) and then updates thekustomization.yamlin theoverlays/stagingdirectory with these new, correct tags. Thestaging-initialimage simply didn’t exist in my GCR. - The Complexity: This creates a race condition. The initial deployment attempts to pull a non-existent image, causing pods to get stuck in
ImagePullBackOff. Even when the CI/CD pipeline successfully updates the Git repository with the correct SHA-based tags, the existing, failing pods might not immediately pick up the new image reference or restart. They remain in a persistent retry loop for the old, non-existent image. - The Solution (Next Step): To unblock the current deployment, I need to ensure that an image with the
staging-initialtag exists in my GCR for each service. Alternatively, I can force a rollout of the deployments to make them pick up the latest image references from the updated Kustomize configuration.
3. The Dependency Drift: A Tale of Two package.jsons
I discovered a classic Node.js problem in the broadcaster service.
- The Mistake: The
package.jsonandpackage-lock.jsonfiles were out of sync. The lock file contained a different version ofaxiosand even includedwinston, a package that wasn’t listed as a dependency at all. This is a recipe for “it works on my machine” bugs. - The Fix: The fix was simple but crucial: I ran
npm installin the service’s directory and committed the updatedpackage.json. This ensures that both local development and the CI/CD pipeline build from the exact same dependency tree.
4. The Inefficiency: A Heavy Frontend for a Light Job
My frontend was over-engineered.
- The Mistake: I was using a full Node.js Koa server to serve what was essentially a single, dynamically generated HTML file. My own
Dockerfileeven had a commented-outnginximplementation that I had ignored. - The Fix (Next Step): The plan is to refactor this into a multi-stage Docker build. A
nodestage will build the static HTML file, and a final, lightweightnginxstage will serve it. This will result in a smaller, faster, and more secure container.
Chapter 9: The Kustomize Conundrum and Service Connectivity
Just when I thought the deployment was stable, new challenges emerged, highlighting the intricate dance between Kustomize, ArgoCD, and inter-service communication.
1. The Stubborn ImagePullBackOff: Kustomize Overlays vs. Reality
Even after correctly configuring GCR project IDs and ensuring my CI/CD pushed SHA-tagged images, pods were still stuck in ImagePullBackOff, trying to pull images with the staging-initial tag.
- The Problem: My
baseKustomize configuration specifiednewTag: staging-initialfor the images. Kubernetes tried to pull these images immediately. However, my CI/CD pipeline builds images with SHA-based tags (e.g.,staging-b287111) and then updates thekustomization.yamlin theoverlays/stagingdirectory with these new, correct tags. Thestaging-initialimage simply didn’t exist in my GCR. - The Docker Hub Detour (and why it was a band-aid): In an attempt to unblock, I temporarily switched the
overlays/staging/kustomization.yamlto point to Docker Hub images. This was a quick fix to get any image pulled, but it wasn’t the long-term solution as my CI/CD pipeline pushes to GCR. - The Strategic Merge Patch Breakthrough: The real solution came from understanding Kustomize’s patching mechanisms more deeply. Instead of relying on the
images:field (which seemed to be problematic for direct overrides), I created explicit strategic merge patch files for each deployment (broadcaster,todo-backend,todo-frontend). These patches directly set theimagefield of the container to the full GCR image path including the SHA tag (e.g.,gcr.io/dwk-gke-458706/broadcaster:staging-b287111). This forced the Kubernetes Deployment objects to update their image references. - The Reversion: Once this explicit patching strategy proved successful in getting the pods to pull the correct images, I reverted these hardcoded strategic merge patches. The goal is for the CI/CD pipeline to dynamically update the
images:field inoverlays/staging/kustomization.yaml, and for ArgoCD to correctly apply that. This is the next phase of refinement.
2. The Broadcaster’s Identity Crisis: NATS Connectivity
Even after the image issues were resolved, the broadcaster pod was still crashing with getaddrinfo ENOTFOUND my-nats.
- The Problem: The
broadcasterservice was trying to connect to the NATS server using the service namemy-nats. Whilemy-natsexists, it was deployed in thedefaultnamespace, and thebroadcasterwas in thestagingnamespace. Kubernetes service discovery requires the fully qualified domain name (FQDN) for cross-namespace communication. - The Solution: I updated the
NATS_URLenvironment variable in thebroadcaster-deployment.yamlto use the FQDN:nats://my-nats.default.svc.cluster.local:4222. This allowed thebroadcasterto correctly resolve and connect to the NATS service. - Staging Mode Confirmation: This also confirmed that my existing
broadcaster-patch.yaml(which setsDISCORD_WEBHOOK_URLto an empty string) was correctly being applied, ensuring the broadcaster runs in a safe, log-only mode in staging.
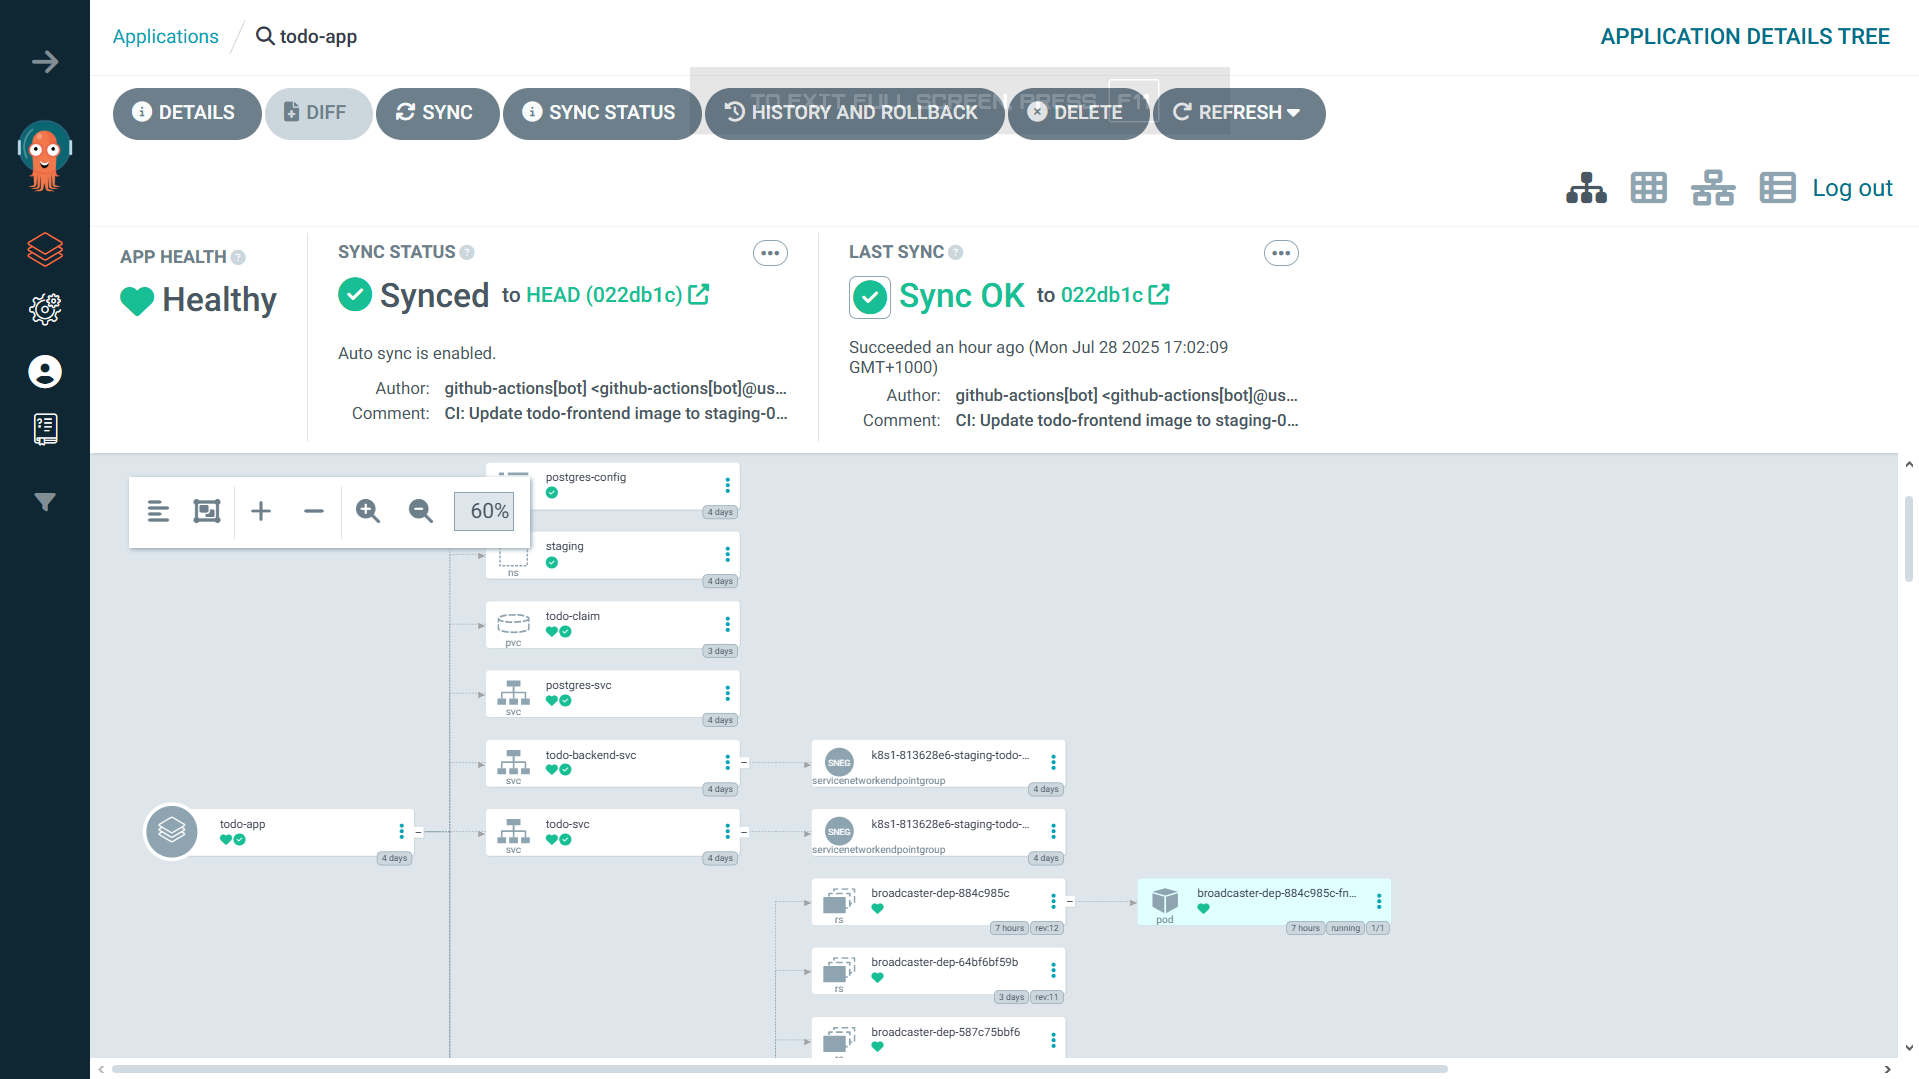
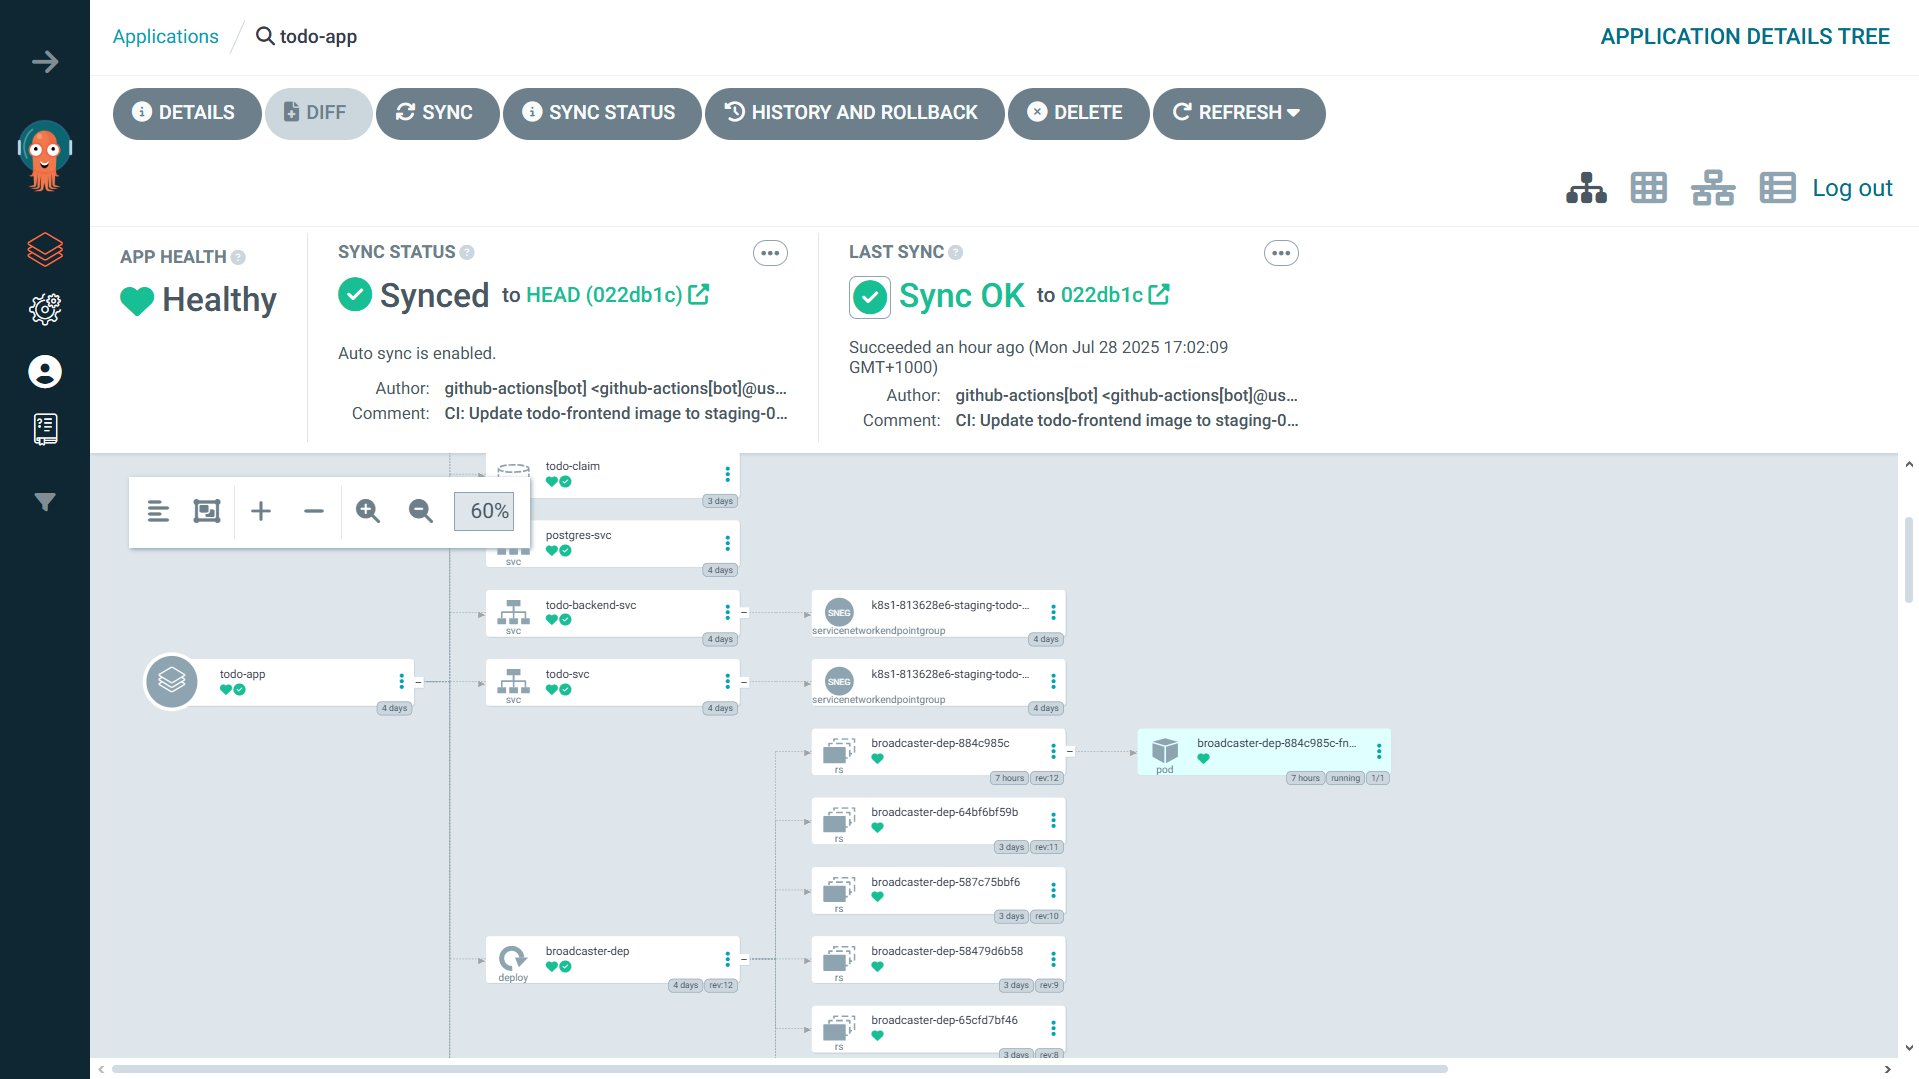
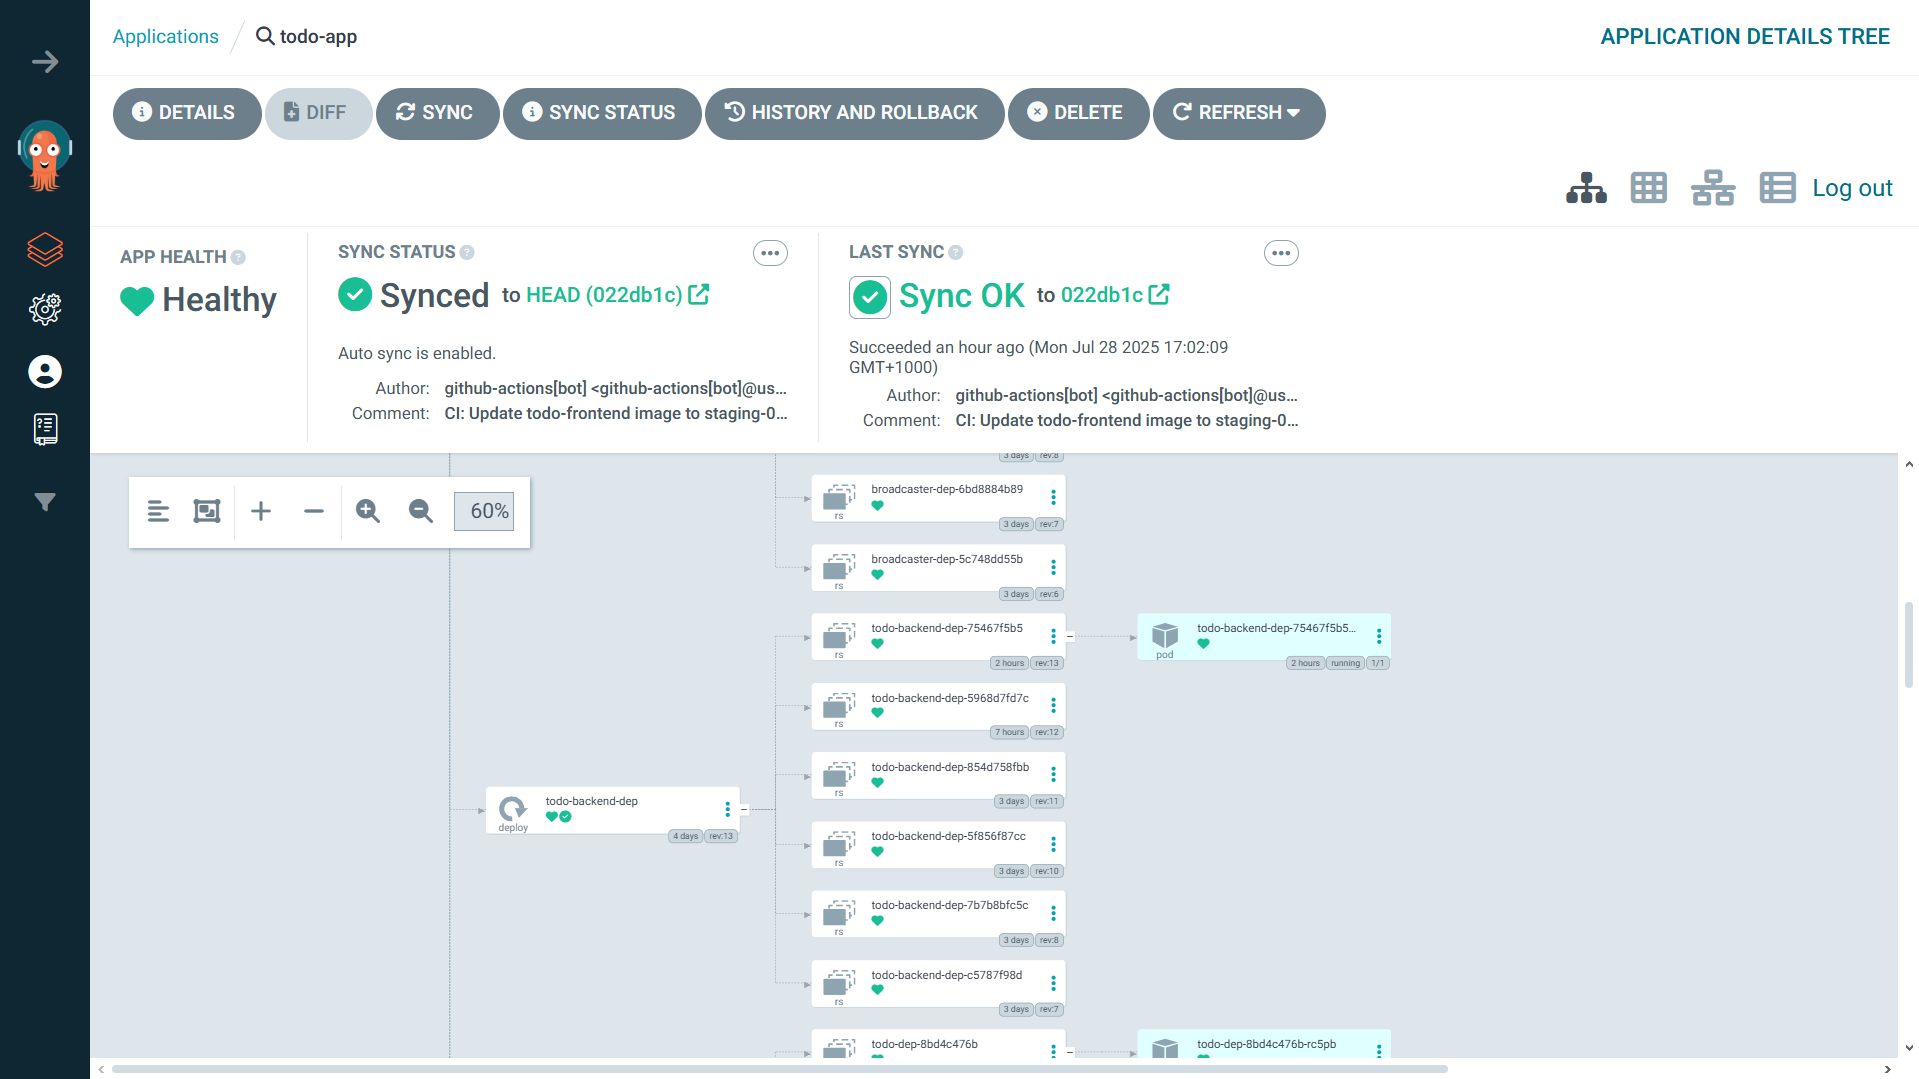
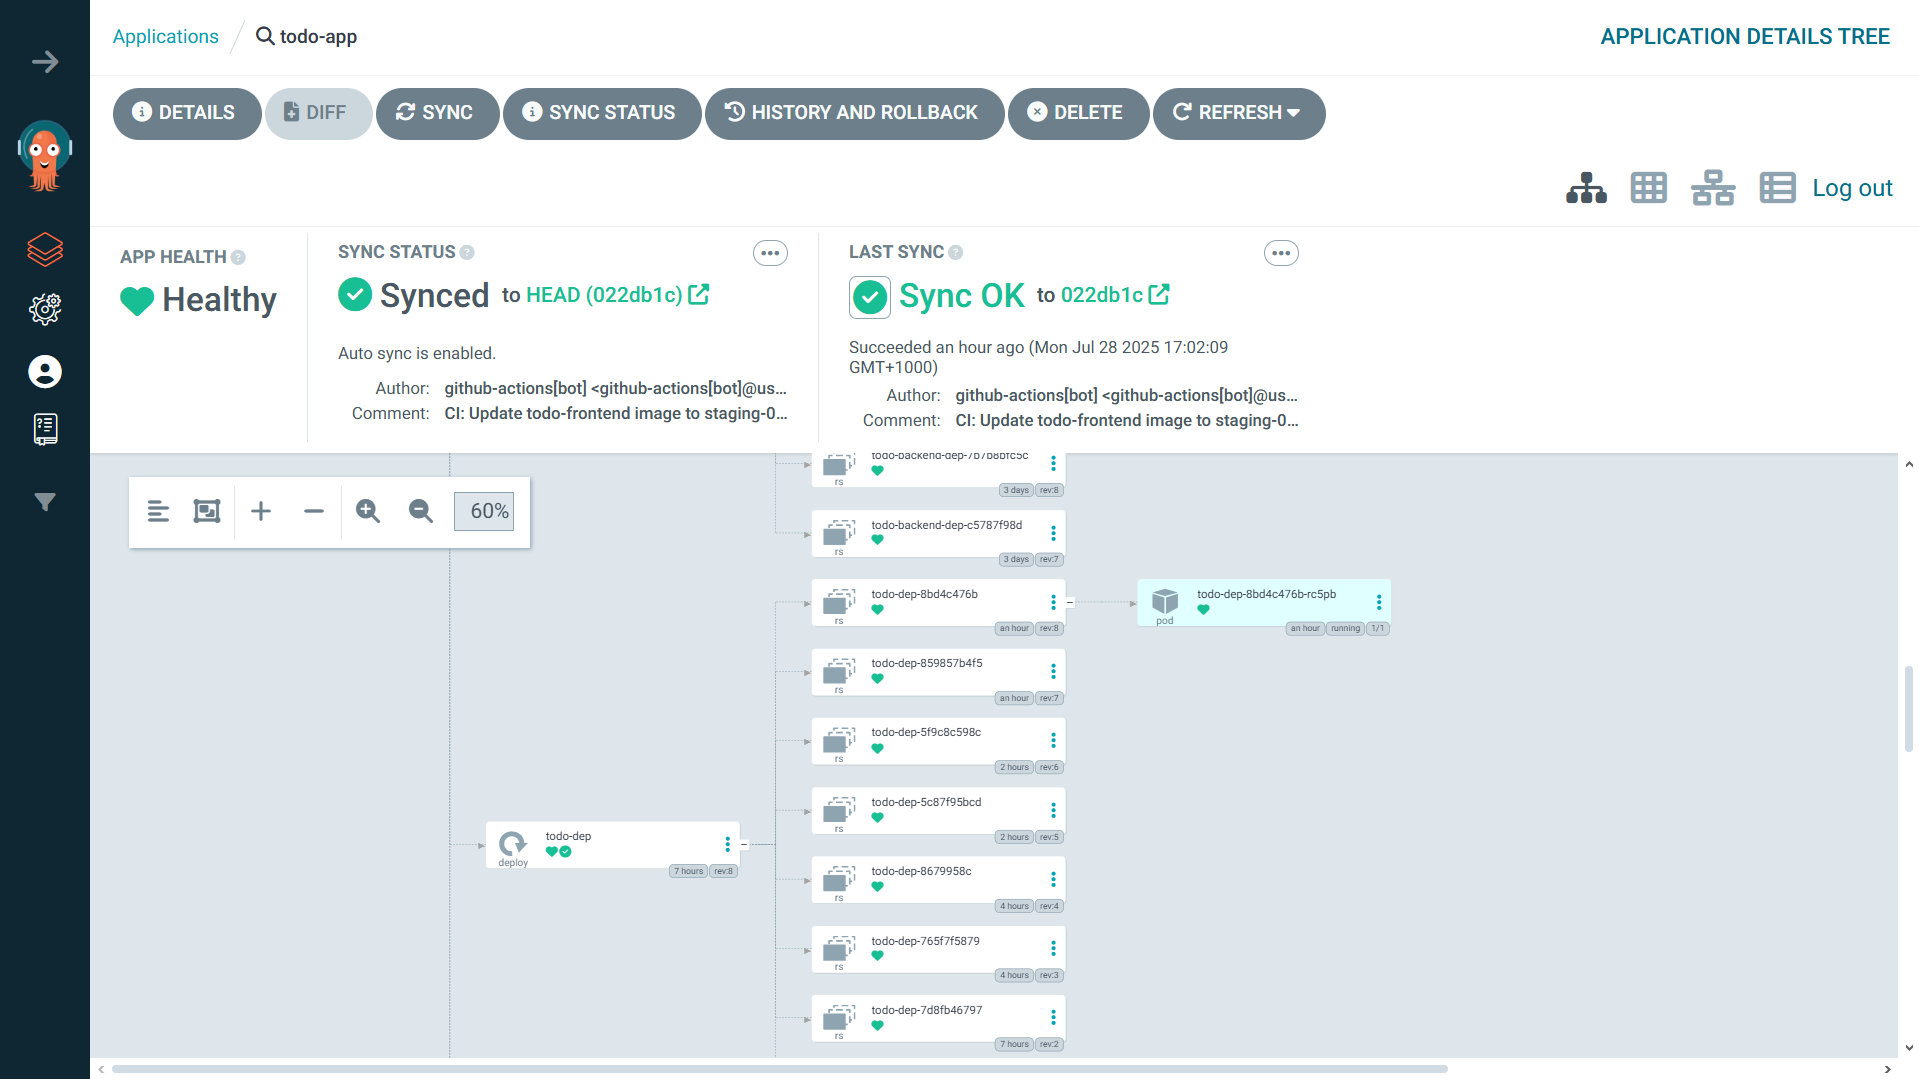
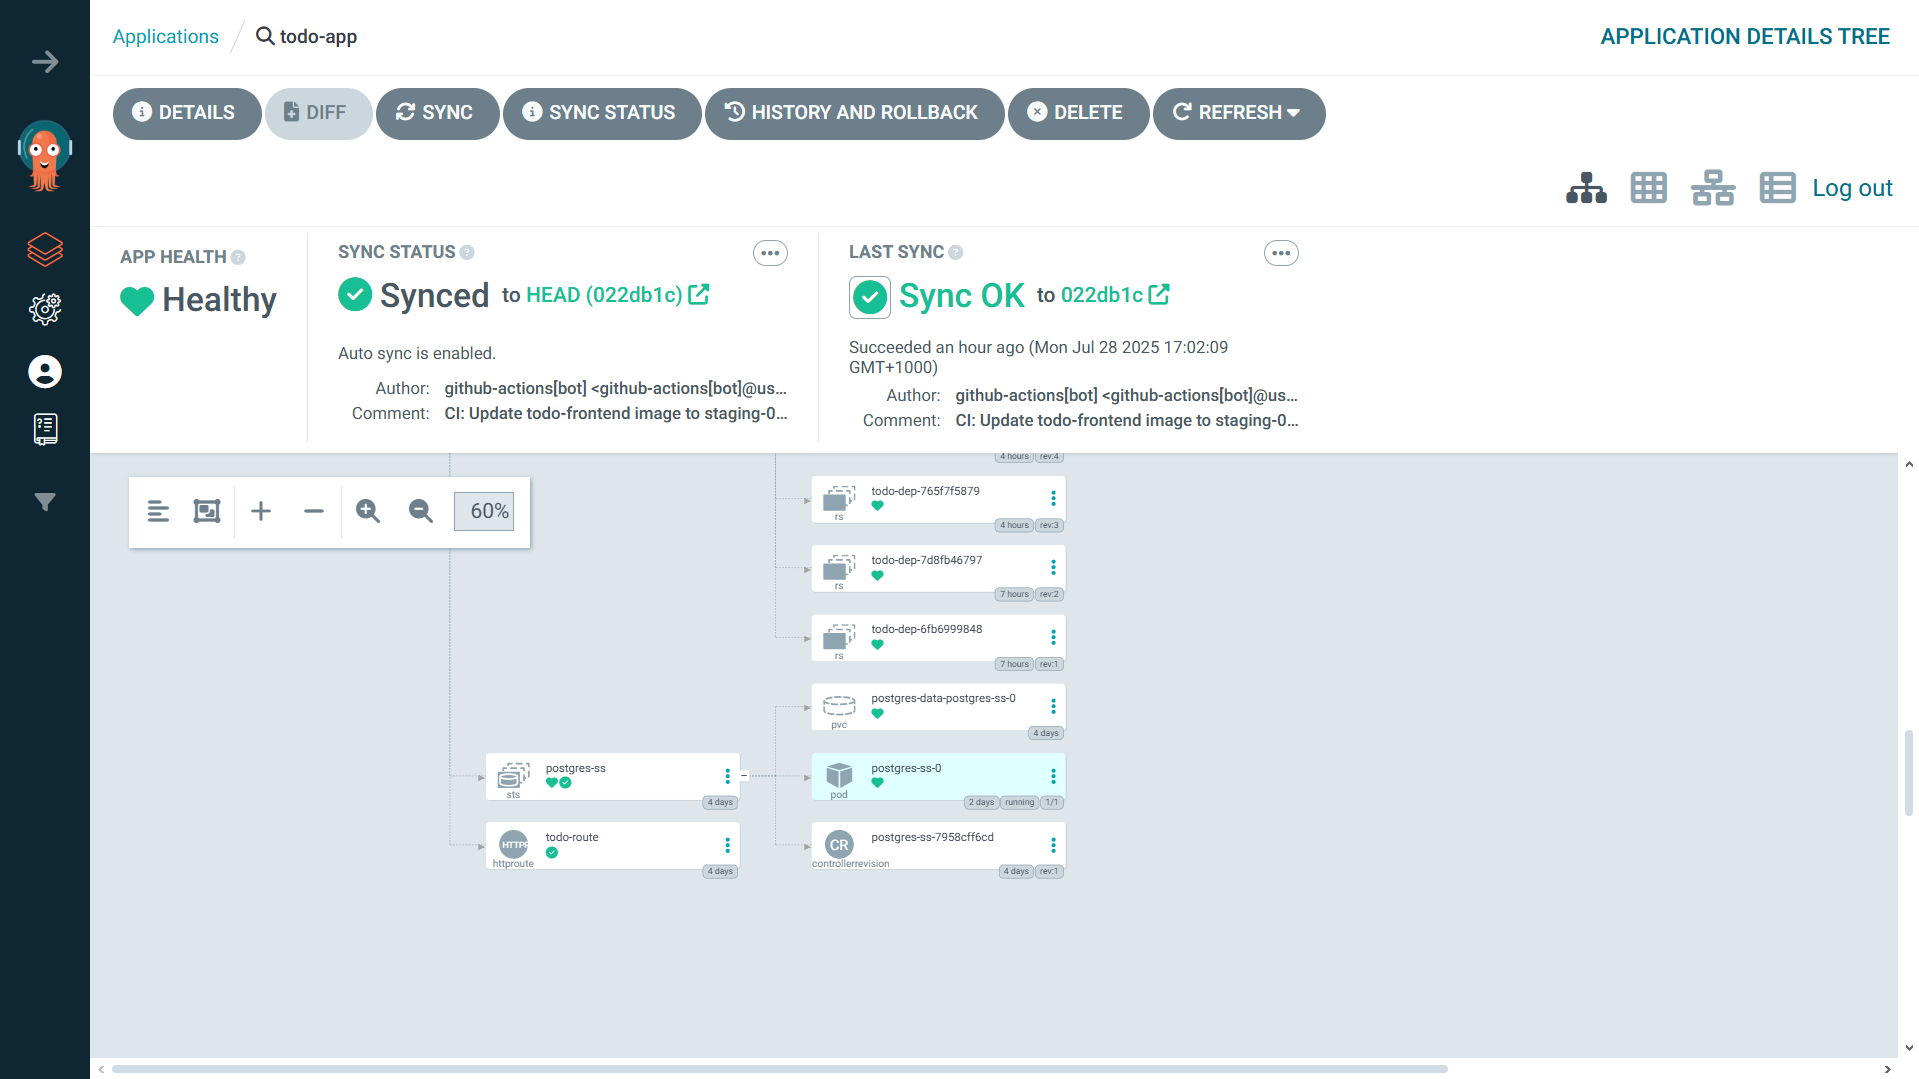
Overall Application Look
Here are some screenshots of the overall application:
Conclusion: I Didn’t Just Build an App, I Built a Platform
This Todo app journey was my crucible. It took me from the basics of Pods and Services to the advanced, real-world challenges of stateful sets, multi-environment deployments, and secure GitOps workflows. I didn’t just learn a list of commands; I learned how to think like a cloud-native engineer.
I now have the skills to design, build, and manage a resilient, observable, and fully automated system on Kubernetes. This project is more than just a portfolio piece; it’s a testament to the deep, practical knowledge that can only be gained by building. And I’m ready to build what’s next.